Data Acquisition
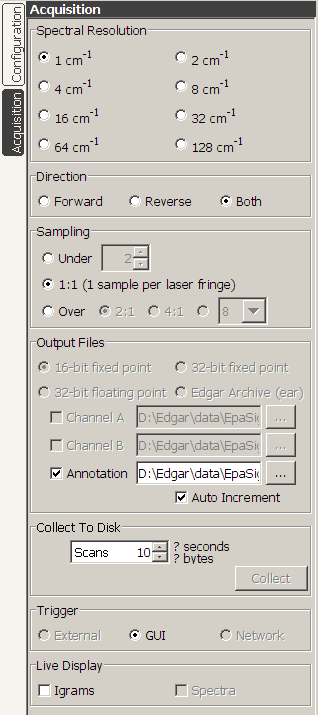 | Data acquisition is controlled from the Acquisition panel,
which can be viewed by pressing the Acquisition
tab on the left edge of the Edgar window. This panel provides controls
for spectral resolution, acquisition direction, sampling mode, output
file names, collection time, triggering, and
live display.
All of these settings are common controls for both detectors. The default sample spacing is 1:1 (1 sample per laser fringe). For some instrument configurations, a 2:1 sampling option (2 samples per laser fringe) is available. The Output Files section specifies the file names to use when saving collected data to disk. The last name used for each file is stored in the Edgar ini file and is restored at startup. If the Auto Increment option is selected, any decimal digits in the output file name are used to form an integer that is incremented by 1 each time a new collection is made. This option has no effect if there are no decimal digits in the file name. As an example, if you start with the file name "Run001.igm", the text in the file name field will change after each file is acquired, first to "Run002.igm", then to "Run003.igm", etc. Data files generated by Edgar are Grams/SPC multifiles with the new style header. Radio buttons are provided to select among 16-bit fixed point, 32-bit fixed point, and 32-bit floating point for the raw data files. The first 512 bytes of all files are the main header block. The next 32 bytes are the first subheader block. After the subheader is the raw igram data, which varies in size based on the spectral resolution and sampling mode. After the raw igram data is another subheader block, then the next igram, etc. until the end of file. The X Units parameter in the header is set to "double interferogram", and the First X Coordinate(1) and Last X Coordinate(2) parameters are set to the actual FTS controller limit settings.(3) Data streams for Channel A, Channel B, and the Annotation spreadsheet can be independently turned on or off. The amount of data to be collected is specified as a number of scans. If a live instrument is connected, the number of seconds required and the number of bytes to be collected are computed based on the current instrument settings (speed, resolution, etc.) and the number of scans specified. When you are ready to collect data, press the Collect button, then press Trigger. Trigger mode options are provided for both GUI (the collection trigger comes from the keyboard or mouse) and External (the trigger will comes from an external switch closure at the instrument). The number of scans you requested is streamed to the specified disk files. If you need to abort an acquisition, press the Cancel button at any time and the files are truncated and saved at that point. If an Edgar controlled blackbody is connected to the system, the average blackbody temperature during the acquisition is written into the header memo field. Note that Edgar is designed such that data acquisition always begins on a forward scan (unless the option for reverse only collection has been selected). In GUI trigger mode, the collection trigger will come from the keyboard or mouse. When in External trigger mode, a switch closure on the Annotator Remote Start input(4) will trigger the acquisition. You can also still use the keyboard (or mouse) to trigger even when in External trigger mode, but when in GUI trigger mode you can only use the keyboard (or mouse) to trigger. In Network mode, the trigger will come from another computer system on the network. Note that when operating in a cold environment it is important to reset the system once the unit has reached a stable operating temperature. Otherwise, the ZPD position is likely to have shifted away from the center of the igram, and you will have large phase errors in your data. |
(2) 8-byte double precision float starting at byte 16 in the main header
(3) ZPD will always be in the middle of the interferogram. Edgar will set First X to -(NumberOfSamples-1)/2 and Last X to +(NumberOfSamples-1)/2. There will not be a sample precisely at ZPD, but instead +- one-half laser fringe either side of ZPD. When converted to spectra, the first positive wavenumber is be 0.5 * LaserWavenumber / NumberOfSamples, and the maximum OPD from ZPD is (NumberOfSamples-1)/2 laser fringes. For example, at 1cm-1 there are 32768 samples. First X is -16383.5, ZPD is 0, and Last X is +16383.5. When converted to spectra using a HeNe laser frequency of 15799.7cm-1, First X is 0.2411cm-1, and Last X is 7899.6089cm-1.
(4) Note that the hardware configuration on some systems may not provide direct access to the Remote Start BNC.
Copyright © 2007
IONETRICS.com. All rights reserved • Website by Moondog Web Design ![]()